From Numbers to Sentences: Reading Charts in English
Have you ever seen a chart full of numbers and colors and wondered what it means? Charts are everywhere — in school, in the news, on social media — and they help us understand information quickly. In this lesson, we will learn how to read charts in English and explain them with simple sentences. This is important because charts don’t just show numbers, they tell stories. By learning how to talk about them, you will be able to describe information clearly, compare ideas, and share results just like in real life.
We can describe charts not only with numbers but also with words. The table below shows how percentages and fractions match with natural English expressions.
| Percentage / Fraction | Expression in English |
|---|---|
| 100% | all of the participants / every participant |
| 75% / 3/4 | three fourths of the participants / about three quarters of the participants |
| 50% / 1/2 | half of the participants |
| More than 50% | over half of the participants / the majority of the participants |
| Less than 50% | less than half of the participants / a minority of the participants |
| 25% / 1/4 | a quarter of the participants / about a fourth of the participants |
| Almost 25% | almost a fourth of the participants |
| 10% | a small fraction of the participants |
| 5% or less | a few of the participants / almost nobody |
| 0% | no participants/none of the participants |
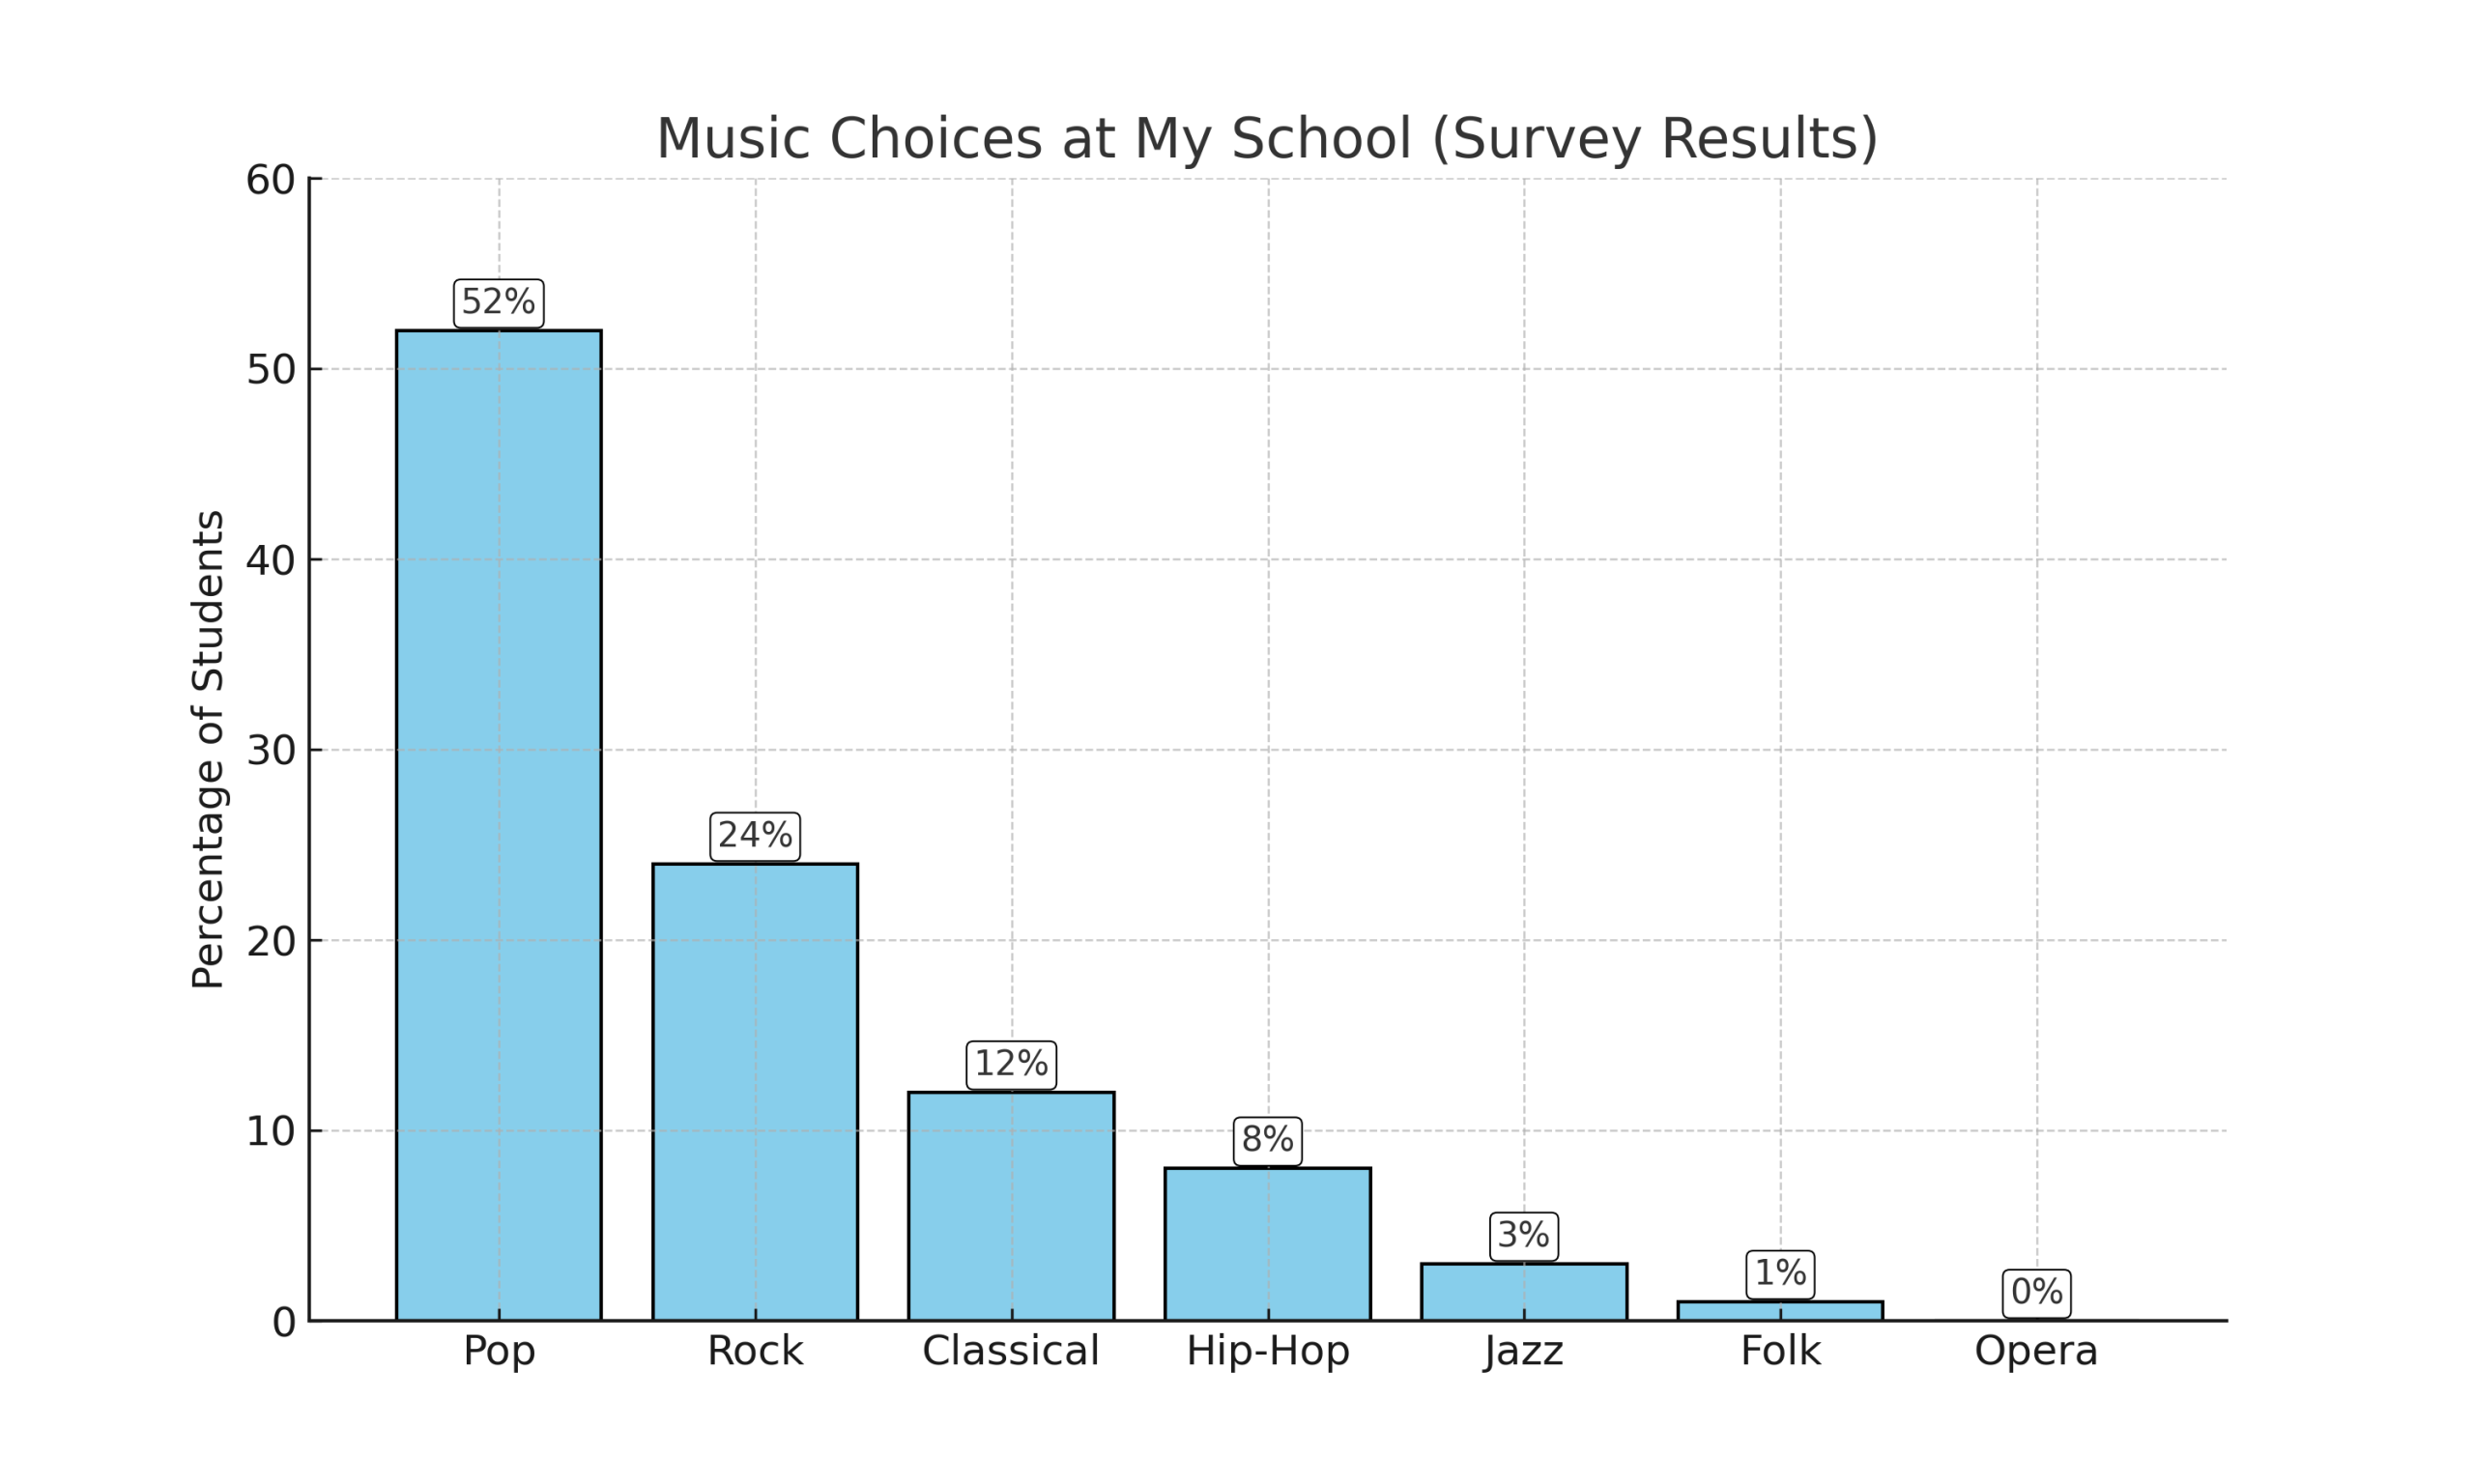
To see how this works, let’s check the results of the school survey made by the English Club at Sunrise High School, 25 River Street, London. Students were asked about their favorite types of music, and the results are shown in the chart below.

Explaining the Survey Results
- Pop music (52%)
More than half of the students seem to have chosen Pop music, which means the majority of the students enjoy this genre. - Rock music (24%)
Almost a quarter of the students like Rock music. This shows that Rock is the second most popular choice in the school. - Classical music (12%)
Less than a quarter of the students prefer Classical music. It is not as popular as Pop or Rock, but it is still chosen by some. - Hip-Hop (8%)
Less than ten percent of the students enjoy Hip-Hop. This means only a small group listens to this style. - Jazz (3%)
Only a very small number of students, about three percent, chose Jazz. It is one of the least popular genres. - Folk music (1%)
Almost nobody listens to Folk music. Only one percent of the students chose it in the survey. - Opera (0%)
No students chose Opera. This means it was not preferred at all in the school survey.
From this survey, we can clearly see the music preferences of the students — which genres are popular with the majority, and which are only chosen by a few or not chosen at all. Charts make it easy to compare these preferences and understand information quickly.


